Same Usage, Five Offers: A $32.88 Bill Difference | BillSave
See how five Alinta Energy offers produced bill estimates from $146.68 to $179.56 when BillSave applied them to the same real household usage data.
REAL-USAGE CASE STUDY
What changes when only the electricity offer changes?
We used one month of half-hourly interval data from the Single Phase System Site available through the IAMMETER public Demo Account. It is a real residential load profile, rather than a synthetic constant load. BillSave applied five Alinta Energy residential electricity offers for the NSW Ausgrid region to the same immutable energy Dataset.
The result was a difference of $32.88 for one month, or 22.42% of the lowest estimate, without changing a single interval of energy use.

IMPORTANT COMPARISON BOUNDARY
A controlled tariff comparison—not a retailer bill
This is a controlled illustration of tariff effects, not the household's real retailer bill and not a switching recommendation. A real residential load profile made available through the IAMMETER public Demo Account was treated as a hypothetical NSW Ausgrid household using Sydney local time.
The HomeDeal versions shown became effective on 5 August 2026; for this natural-month illustration, their published rules were applied to the complete 1–31 August Dataset. The comparison does not claim that those versions were available from 1 August, and eligibility must be checked separately.
RESULTS
The same energy data produced a $32.88 difference
The comparison covers all 31 days of August 2026: 1,488 half-hour intervals, 347.51 kWh of grid import, no grid export and no Controlled Load. All five offers were calculated by BillSave Compare against the same energy revision.
The highest and lowest estimates differed by $32.88. The energy quantity and every half-hour interval remained unchanged; the difference came from daily supply charges, usage rates, time periods and the free-usage rule.
BillSave calculates comparison differences from unrounded internal totals. Because displayed bill totals are rounded to cents, subtracting two displayed totals may differ from the displayed comparison difference by $0.01.
- HomeDeal Smart — Single Rate: $146.68 AUD including GST—the lowest estimate.
- HomeDeal Smart — Time of Use: $158.01; $11.33 or 7.72% above the lowest estimate.
- Standing Offer — Single Rate: $166.69; $20.00 or 13.64% above the lowest estimate.
- Solar Sharer Offer — Time of Use: $179.21; $32.52 or 22.17% above the lowest estimate.
- Standing Offer — Time of Use: $179.56; $32.88 or 22.42% above the lowest estimate.
DATA QUALITY
Why all five results are Estimated
Two half-hour records on 10 August, from 19:00 to 20:00, are marked as estimated rather than actual. Because every offer uses the same immutable energy revision, all five results inherit that data-quality limitation.
Those intervals fall inside the 15:00–21:00 August peak window used by the TOU offers. BillSave therefore ranks these results only within the Estimated group and describes the first result as the lowest estimate under the disclosed assumptions—not a guaranteed cheapest bill.
Readers can still see how five tariff structures respond to the same Dataset, while the quality label prevents estimated input from being presented as fully measured evidence.
TARIFF STRUCTURES
How the five offers charge for electricity
Single Rate offers charge the same general-usage price regardless of time. Time of Use offers change the usage price by time and season, so both the quantity and timing of consumption affect the result. All five offers also include a fixed daily supply charge.
For the three TOU offers in this NSW scenario, the peak period is 15:00–21:00 every day during November–March and June–August, including weekends. The listed peak period does not apply during April–May or September–October.
Solar Sharer's midday free-usage period remains throughout the year, but it is capped at the first 24 kWh in that daily window. Additional usage is charged at the applicable paid rate. All prices listed here include GST.
- HomeDeal Smart — Single Rate: $1.462780 daily supply charge and 29.161 c/kWh at all times.
- HomeDeal Smart — Time of Use: $1.552430 daily supply charge; 52.976 c/kWh peak and 21.153 c/kWh off-peak.
- Standing Offer — Single Rate: $1.662287 daily supply charge and 33.1375 c/kWh at all times.
- Standing Offer — Time of Use: $1.764103 daily supply charge; 60.1964 c/kWh peak and 24.0383 c/kWh off-peak.
- Solar Sharer Offer — Time of Use: $1.764103 daily supply charge; 63.7175 c/kWh peak, 27.5594 c/kWh in other paid periods, and the first 24 kWh each day from 11:00 to 14:00 free.
OFFICIAL SOURCES
HomeDeal Smart — Single Rate
Review the official Energy Made Easy plan and the corresponding executable offer in BillSave.
HomeDeal Smart — Time of Use
Review the official Energy Made Easy plan and the corresponding executable offer in BillSave.
Standing Offer — Single Rate
Review the official Energy Made Easy plan and the corresponding executable offer in BillSave.
Standing Offer — Time of Use
Review the official Energy Made Easy plan and the corresponding executable offer in BillSave.
WHAT THE COMPARISON SHOWS
The selected Standing Offers calculated higher than the corresponding HomeDeal offers
Under this Dataset and the recurring charges represented in the calculation, the two HomeDeal estimates were lower than their corresponding Standing Offer estimates.
This finding applies only to the listed versions and this modelled scenario. It does not establish that every market offer is lower than every standing offer, or that the Demo Site would be eligible to join any offer. Network tariff, meter type, contract conditions and charges outside this scenario still need to be checked.
- The Standing Offer — Single Rate has a higher daily supply charge and a higher per-kWh rate than HomeDeal Smart — Single Rate.
- The Standing Offer — Time of Use has a higher daily supply charge, peak rate and off-peak rate than HomeDeal Smart — Time of Use.
USAGE TIMING
Whether TOU is suitable depends on when electricity is used
A TOU offer can have a lower off-peak price but a much higher peak price. It may work well when a large share of consumption occurs outside the peak window; a household with substantial evening demand may calculate better under a single rate. Daily supply charges also matter.
In this example, HomeDeal Smart — Time of Use calculated $11.33 higher than HomeDeal Smart — Single Rate. TOU was therefore more expensive for this particular load profile and assumptions, but that does not mean TOU is generally more expensive.
THE LOAD PROFILE
What the example household load profile looks like
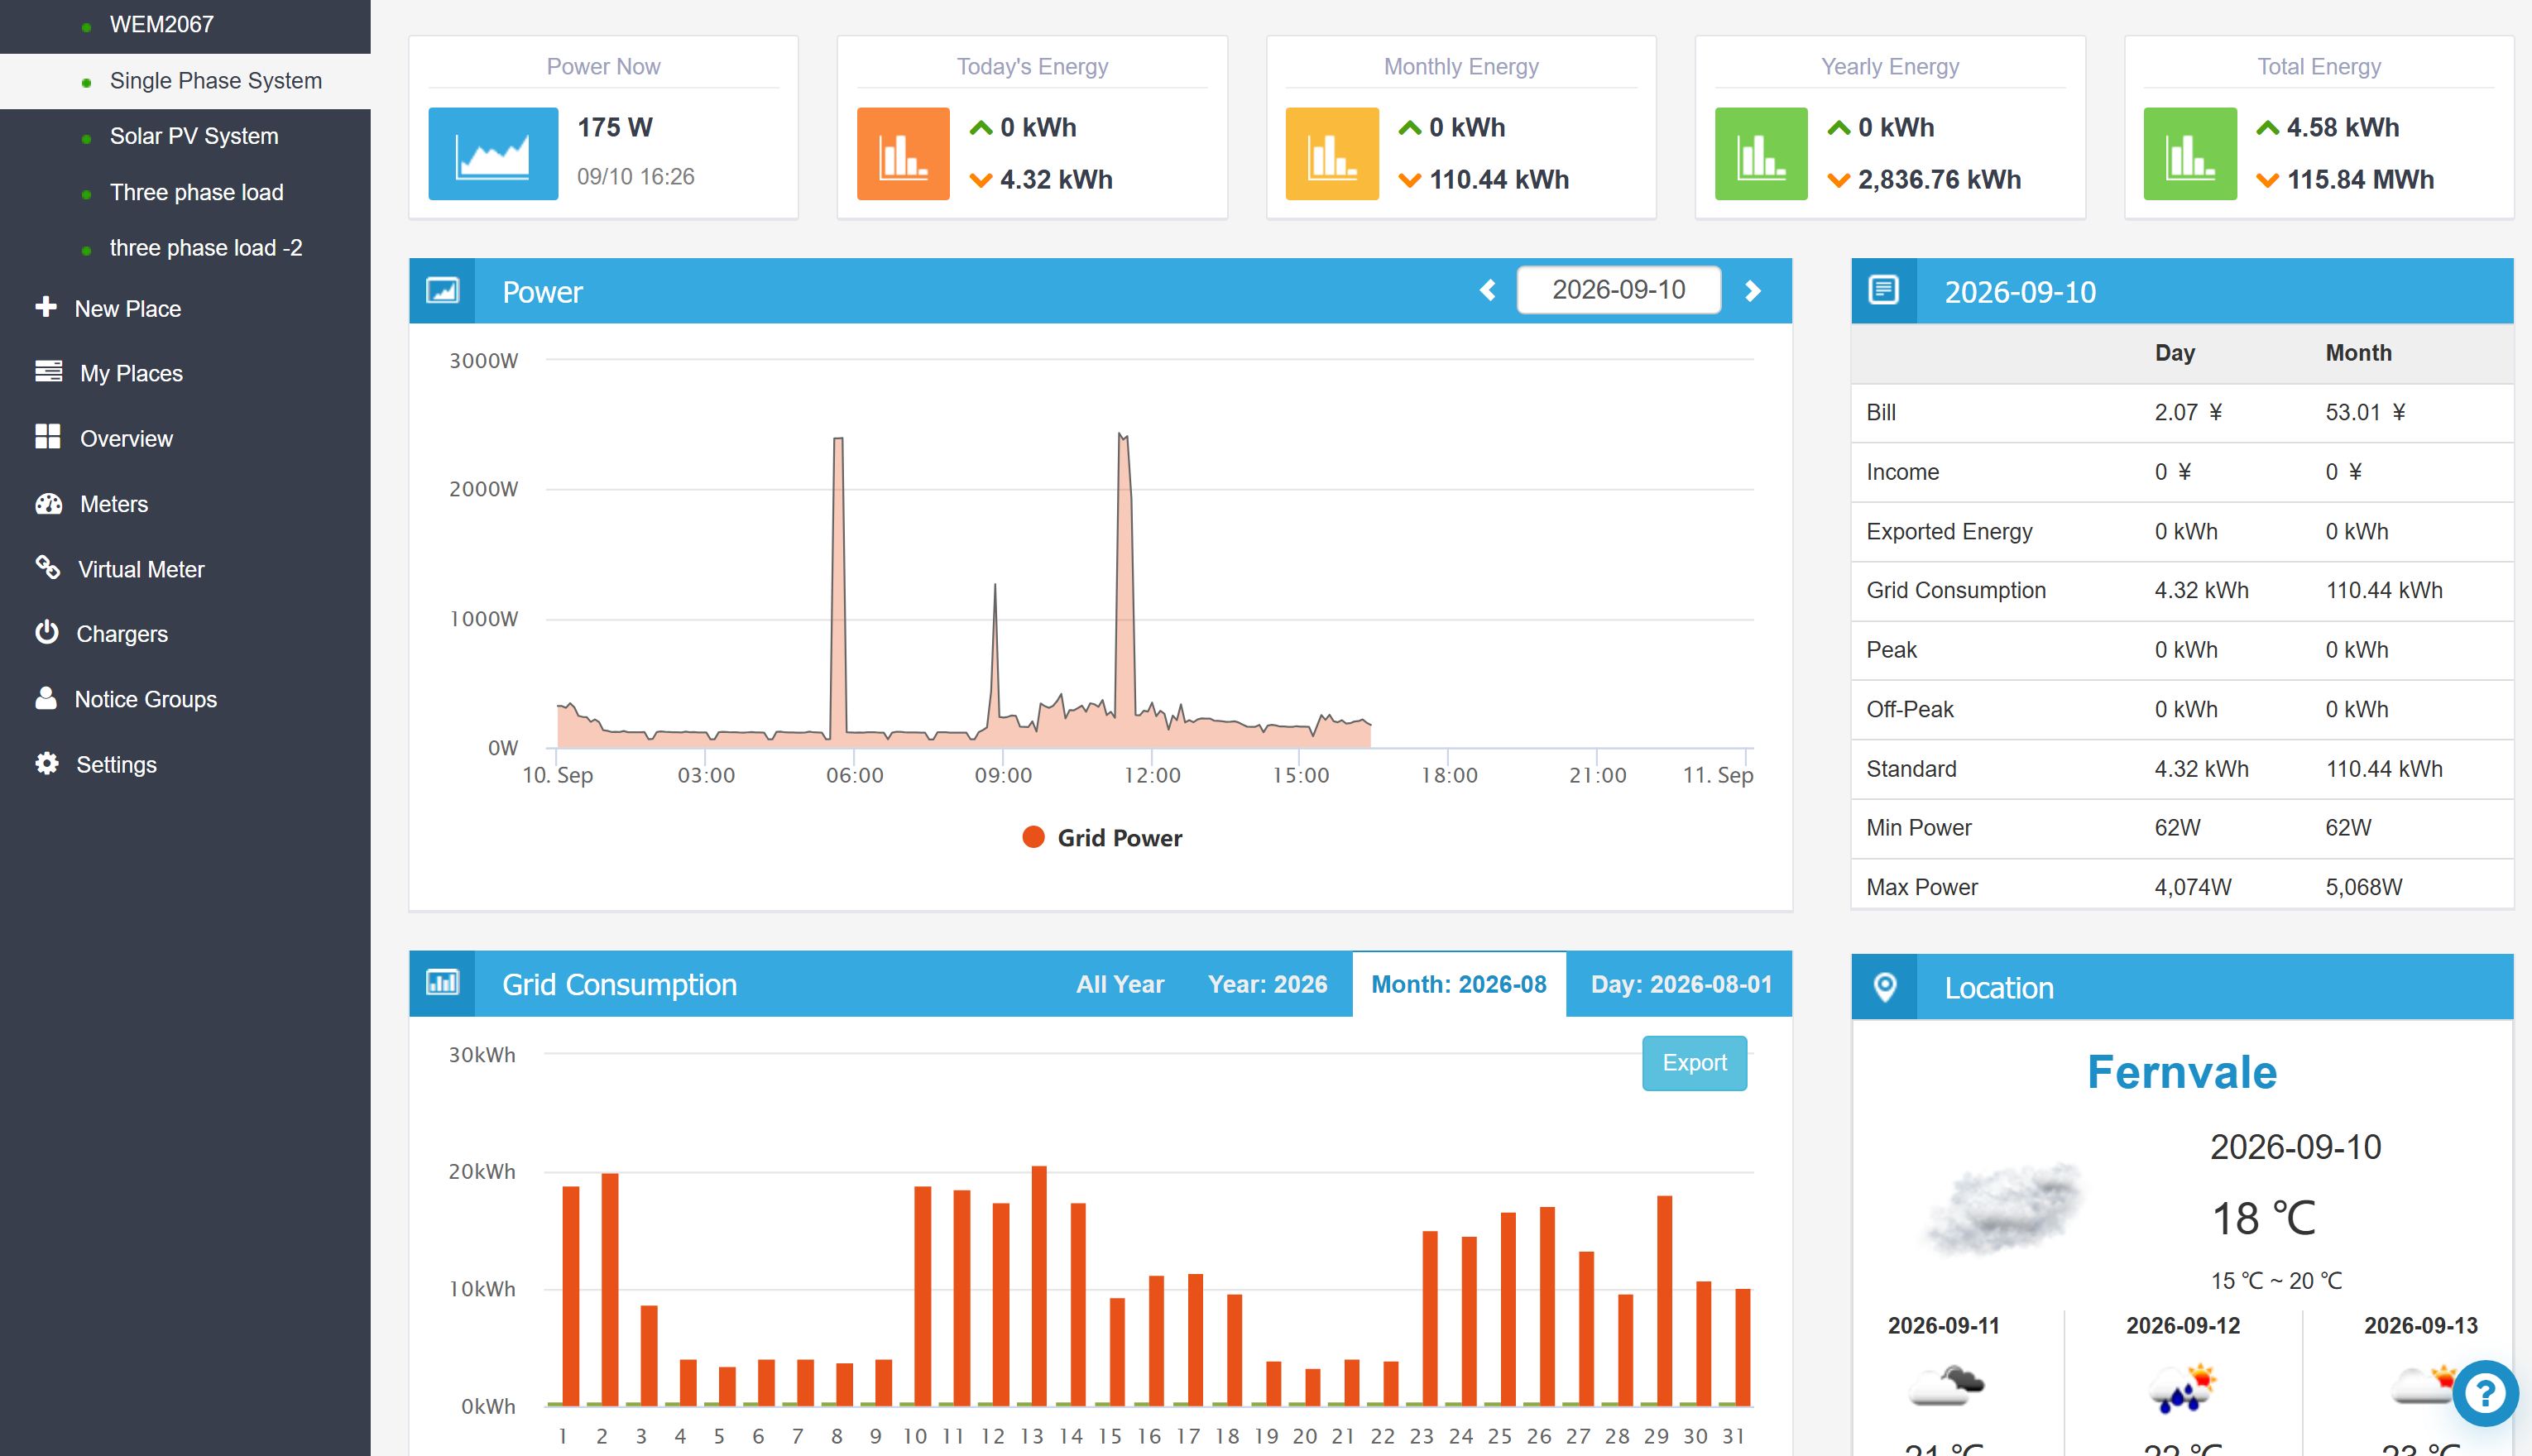
Click View the detailed source data in the IAMMETER Demo Account below to open the Single Phase System Site and inspect the original power and energy history used as the source for this case study.
This Site shows realistic household variation: a low background load, short high-power events and substantial differences in daily energy use across the month. The upper chart in the screenshot shows power on 10 September, while the lower chart shows daily grid consumption for August 2026.
Another household with daytime EV charging, electric heating, rooftop-solar export or more shiftable loads could produce a different gap and even a different ranking.
- Monthly grid import: approximately 347.51 kWh.
- Average daily grid import: approximately 11.21 kWh.
- Average power across the month: approximately 467 W.
- Grid export: zero.
- Data quality: two half-hour intervals were estimated rather than measured as Actual.
NEXT CASE STUDIES
More tariff effects to examine
This first case study focuses on daily supply charges, single-rate and TOU usage rates, and a capped free-usage period. Although the selected offers include ordinary solar feed-in terms, this calculation contained no grid export, so no feed-in credit was produced.
- Controlled Load circuits.
- Demand charges.
- Solar feed-in credits and different FiT rules.
- Batteries and deliberate load shifting.
USE YOUR OWN DATA
Try the same comparison with your own data
No electricity offer can be identified as suitable for every customer from its name or headline rate alone. BillSave lets you apply supported offer rules to your own interval consumption data and keep the energy input fixed across the comparison.
BillSave results are estimates for comparison, not retailer invoices, financial advice or guarantees of eligibility, availability or savings. Confirm current rates, network and meter requirements, contract terms and eligibility with the retailer before making a decision.
- Upload interval CSV: create a BillSave account with your email and upload 5, 15 or 30-minute consumption data. No IAMMETER account or device is required.
- Connect IAMMETER Cloud: continue with IAMMETER and authorise BillSave to load a Site and billing period directly, without manually exporting CSV.